Analyzing logs with Kibana#
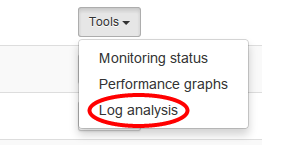
Kibana is accessible on My Flying Circus via the Tools drop-down box of the machine having the loghost role assigned:
Note
You need the stats permission to access Kibana.
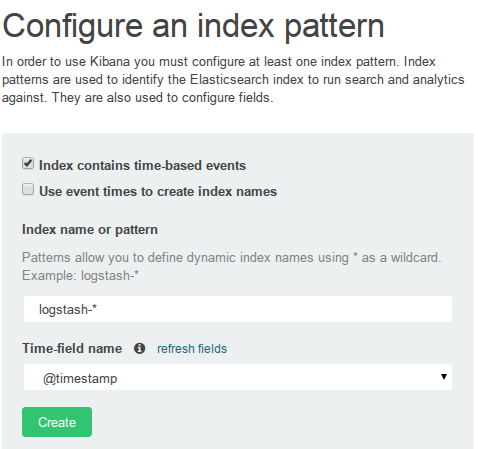
Creating an index pattern#
When accessing your loghost’s Kibana for the first time, you will be asked to create an index pattern. Choose @timestamp as your Time-field name:
Now, you can start using Kibana. We recommend the tutorial from Tim Roes if you are new to Kibana.
Kibana will show all the data that is stored in Elasticsearch. Initially, these are the inputs that are included by us:
custom filter pattern for HAPRoxy (
/var/log/haproxy.log)custom filter pattern for nginx access logs (
/var/log/nginx/*access.log)custom filter pattern for nginx performance logs (
/var/log/nginx/performance.log)
For additional data sources, just add your own configuration snippets to configure_logstash or configure_logstash-forwarder, respectively.
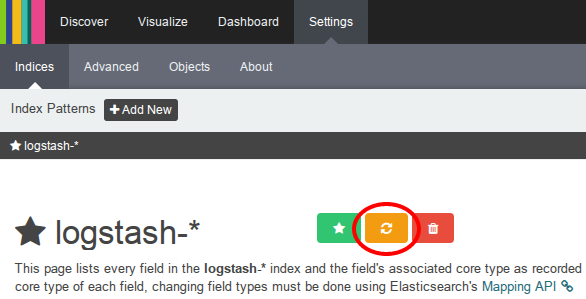
Refreshing your index pattern (reload field list)#
Every time your index properties in Elasticsearch change (e.g. when adding new logstash inputs), make sure to update your respective index patterns pattern in Kibana to reflect these changes.
Warning
if you miss this step, you might not see your changes in Kibana (e.g. newly introduced fields).
To update your index pattern, go to Settings -> Indices and select your index pattern (logstash-* in our case). Then, just hit the Reload field list button: