Statshost (Grafana, Prometheus, Loki)
For metric collection and visualization we employ the renowned Alloy -> Prometheus (+ Loki) -> Grafana stack. If configured, all kinds of metrics from all of your RG’s VMs are automatically routed to one VM running Prometheus and Grafana.
In order to configure this stack, you just need to add the statshost-master role to one your VMs
and optionally the loki role if you want to ingest, store and visualize logs like the system journal
or other logfiles on your VMs.
Configuration
To make our stack fit your application, you can of course configure them to suit your use-case. The services you might want to configure are Grafana to visualize the aforementioned logs and metrics as well as Alloy so you can read, process and forward any kind of metrics or logs to Prometheus/Loki.
Grafana
We provide a few example dashboard, but you can always add your own that are tailored to your specific needs.
You can find these example dashboards in the Feature Lab dashboard folder in the Grafana web UI - feel
free to copy and adjust them to your liking.
For more information on Grafana and how to configure additional dashboards we recommend you check out their official website (https://grafana.com/) as well as the technical docs (https://grafana.com/docs/grafana/latest/).
Alloy
Unfortunately, since the configuration language is a custom implementation, there is no module to configure alloy directly in Nix yet.
Instead, you can configure Alloy on our Nixos platform using the environment.etc option which adds your configuration files
to the /etc/alloy directory.
Any files with the alloy extension in that directory will be sourced by Alloy and integrated as additional configuration.
The following Nix snippet could be used to forward your MySQL Databases’ slowlog to Loki for example:
environment.etc."alloy/mysql_slowlog.alloy".text = ''
    local.file_match "mysql_slowlogs" {
        path_targets = [{
            __path__ = "/var/log/mysql/mysql.slow",
            job_name = "mysql/slowlogs",
        }]
    }

    loki.source.file "mysql_slowlogs" {
        targets    = local.file_match.mysql_slowlogs.targets
        forward_to = [loki.process.mysql_slowlogs.receiver]
    }

    loki.process "mysql_slowlogs" {
        forward_to = [loki.write.fcio_rg_loki.receiver]

        stage.multiline {
            firstline = "^# Time: (?P<time>.+?)"
        }
    }
'';
In the example above, additional logs are read from the MySQL slowlog logfile /var/log/mysql/mysql.slow and forwarded to the
resource group’s Loki receiver.
Since MySQL slow logs typically span multiple lines, a multiline stage is added here to group the lines of one entry.
Details such as content parsing and output formatting have been omitted here for illustrative purposes since they can become quite verbose.
For additional information we recommend you check out the official Alloy docs: https://grafana.com/docs/alloy/latest/configure/.
Log analysis with Loki
Basic exploration
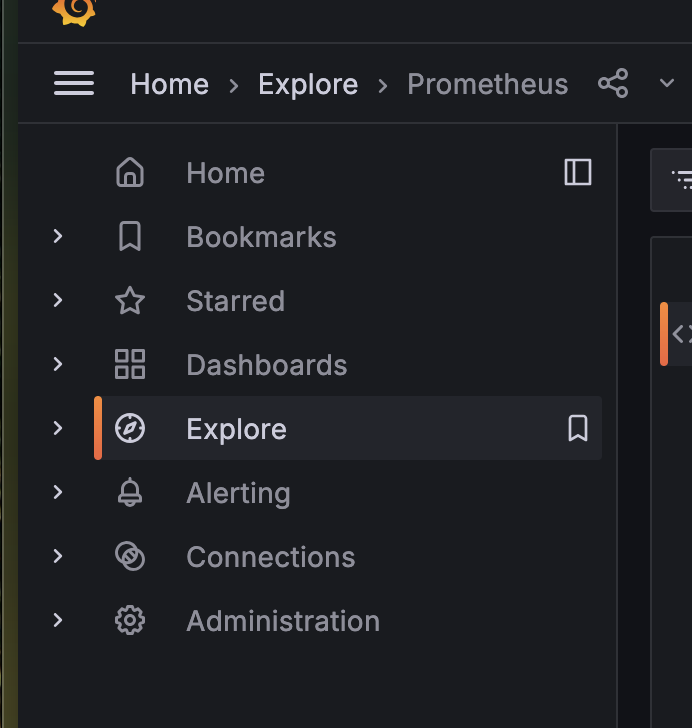
A very simple way to start exploring your VM’s logs is going to your Grafana instance’s Web UI, logging in and selecting Explore in the sidebar
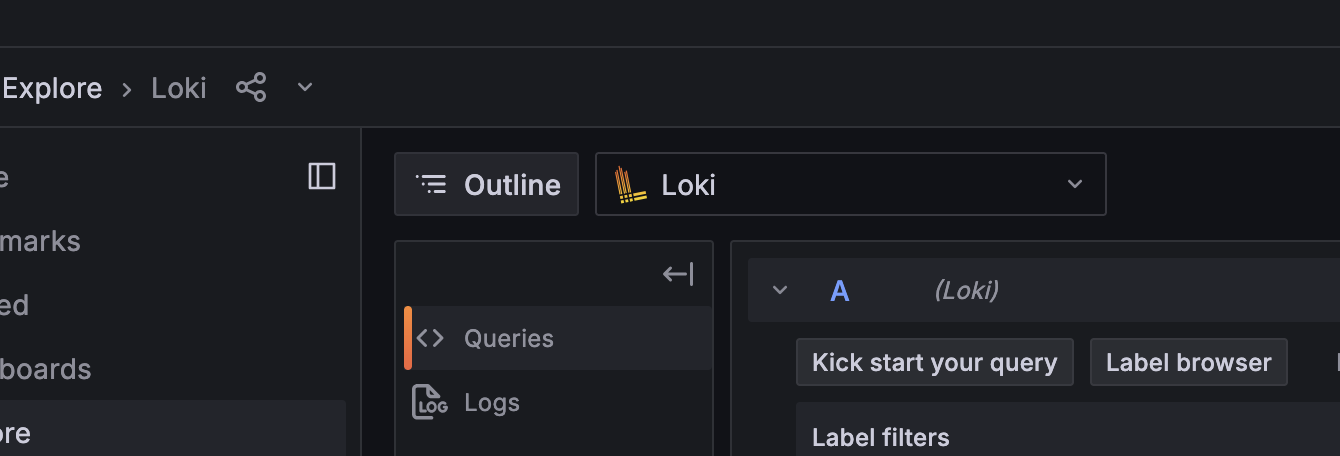
From there you can then select the Loki data source:
and run some queries against it:
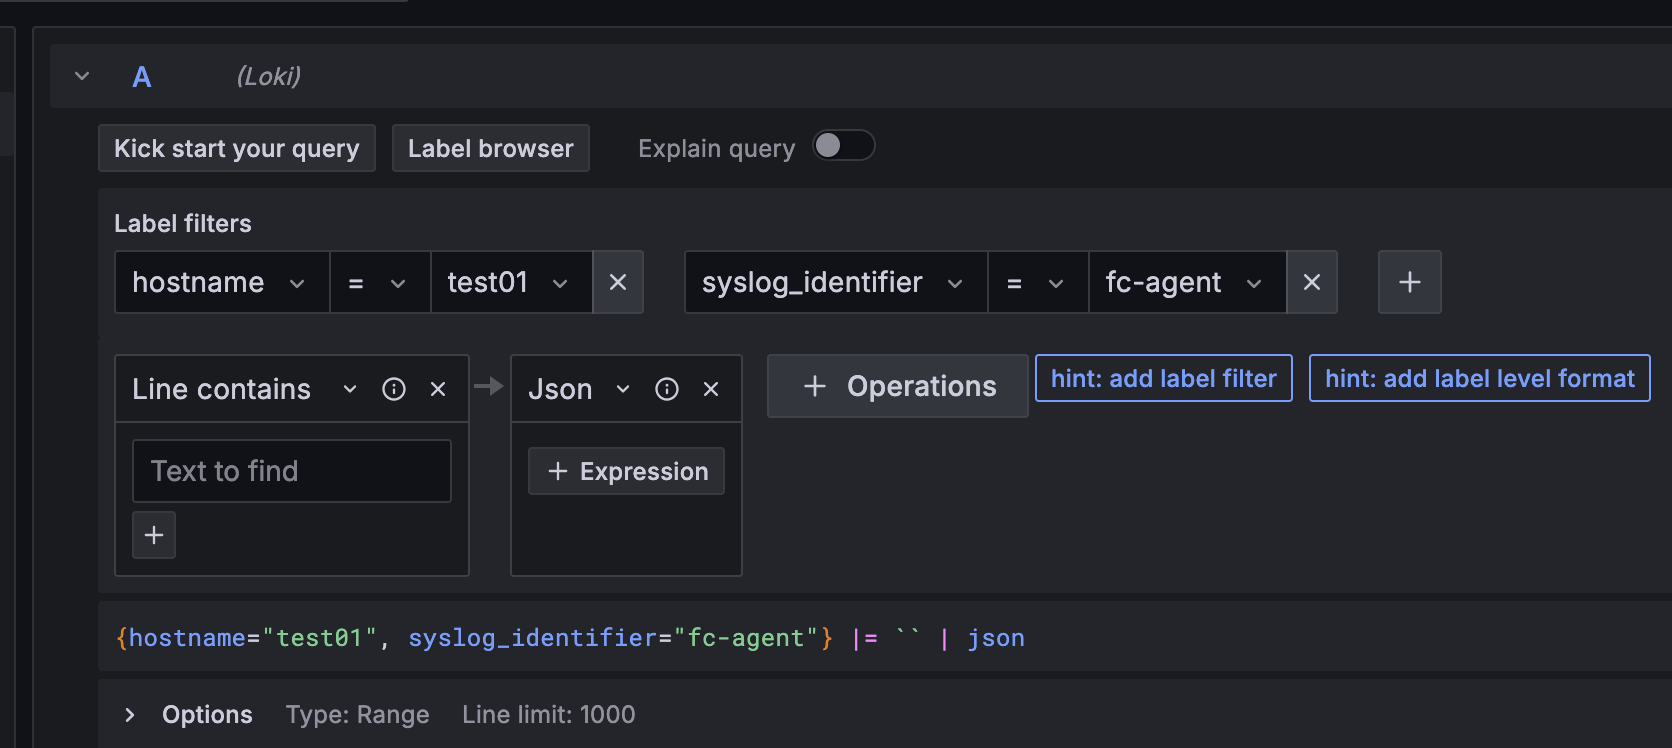
The results will be displayed below
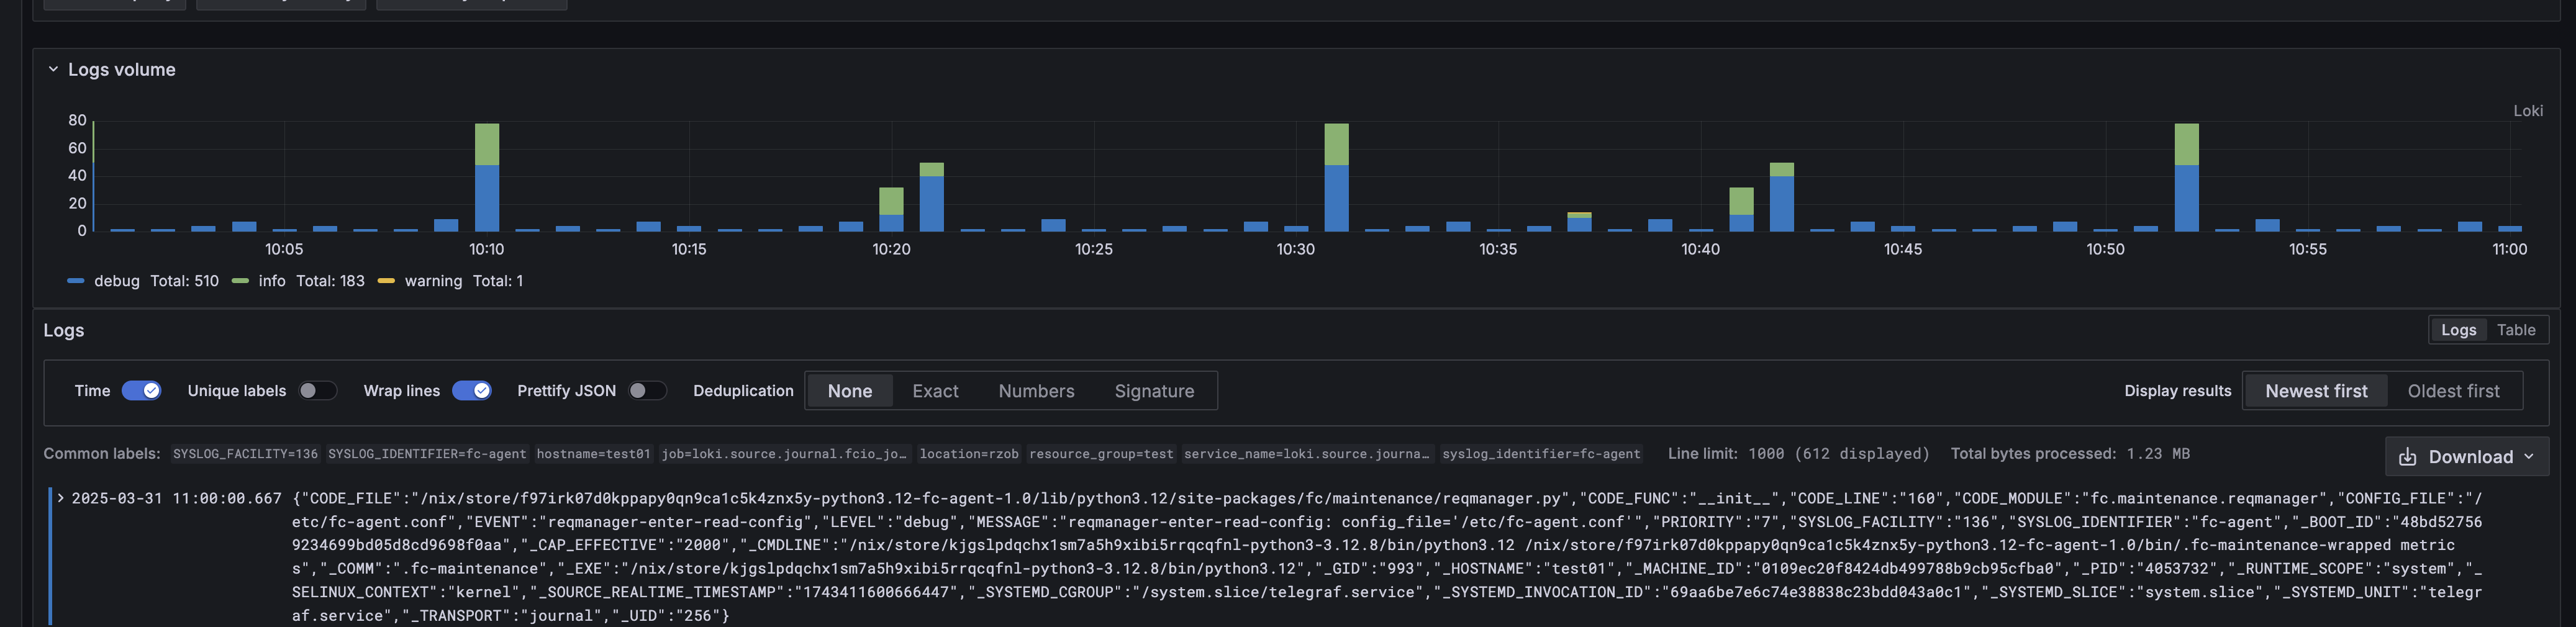
As you can see, the FC Agent runs regularly every 10 Minutes without any issues.
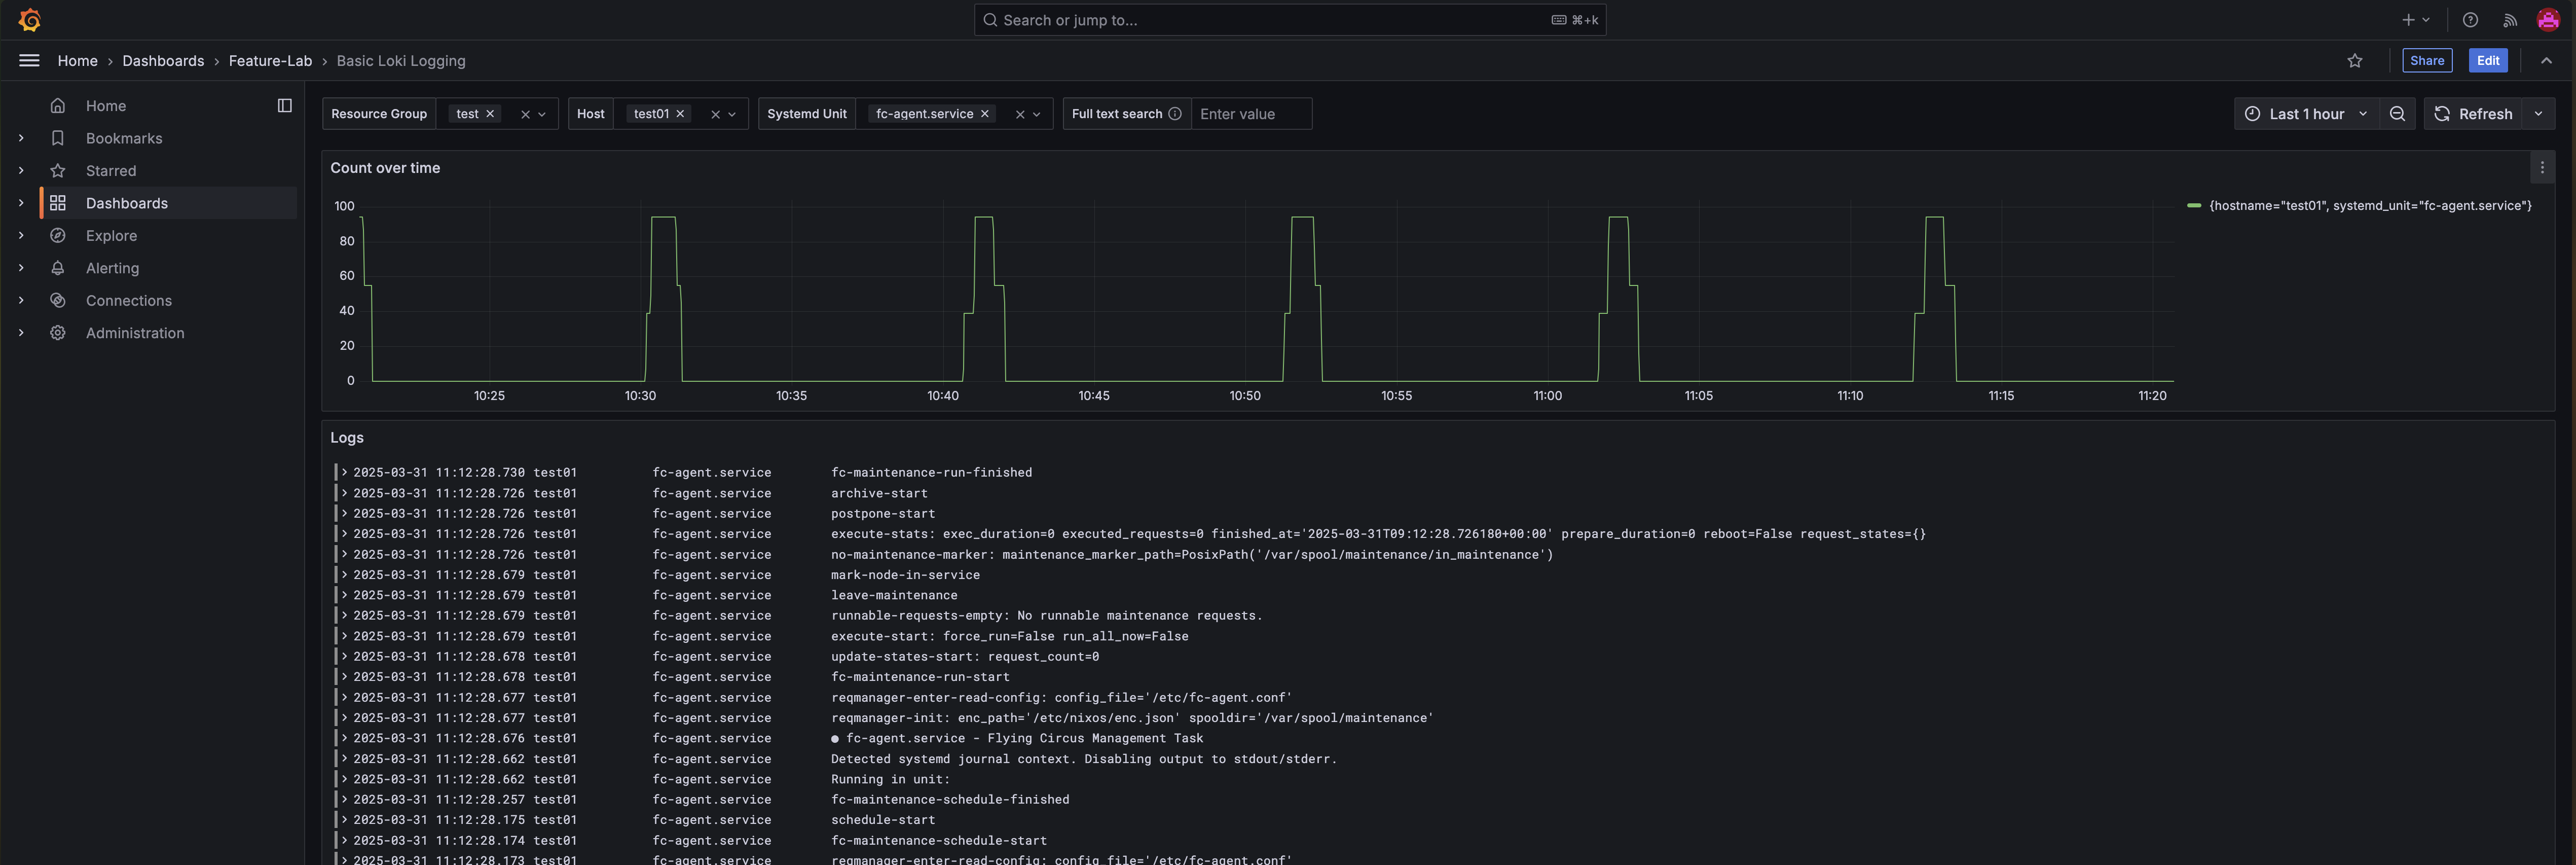
Using the demo dashboards
You can find a few demo dashboard in the Feature Lab dashboard folder
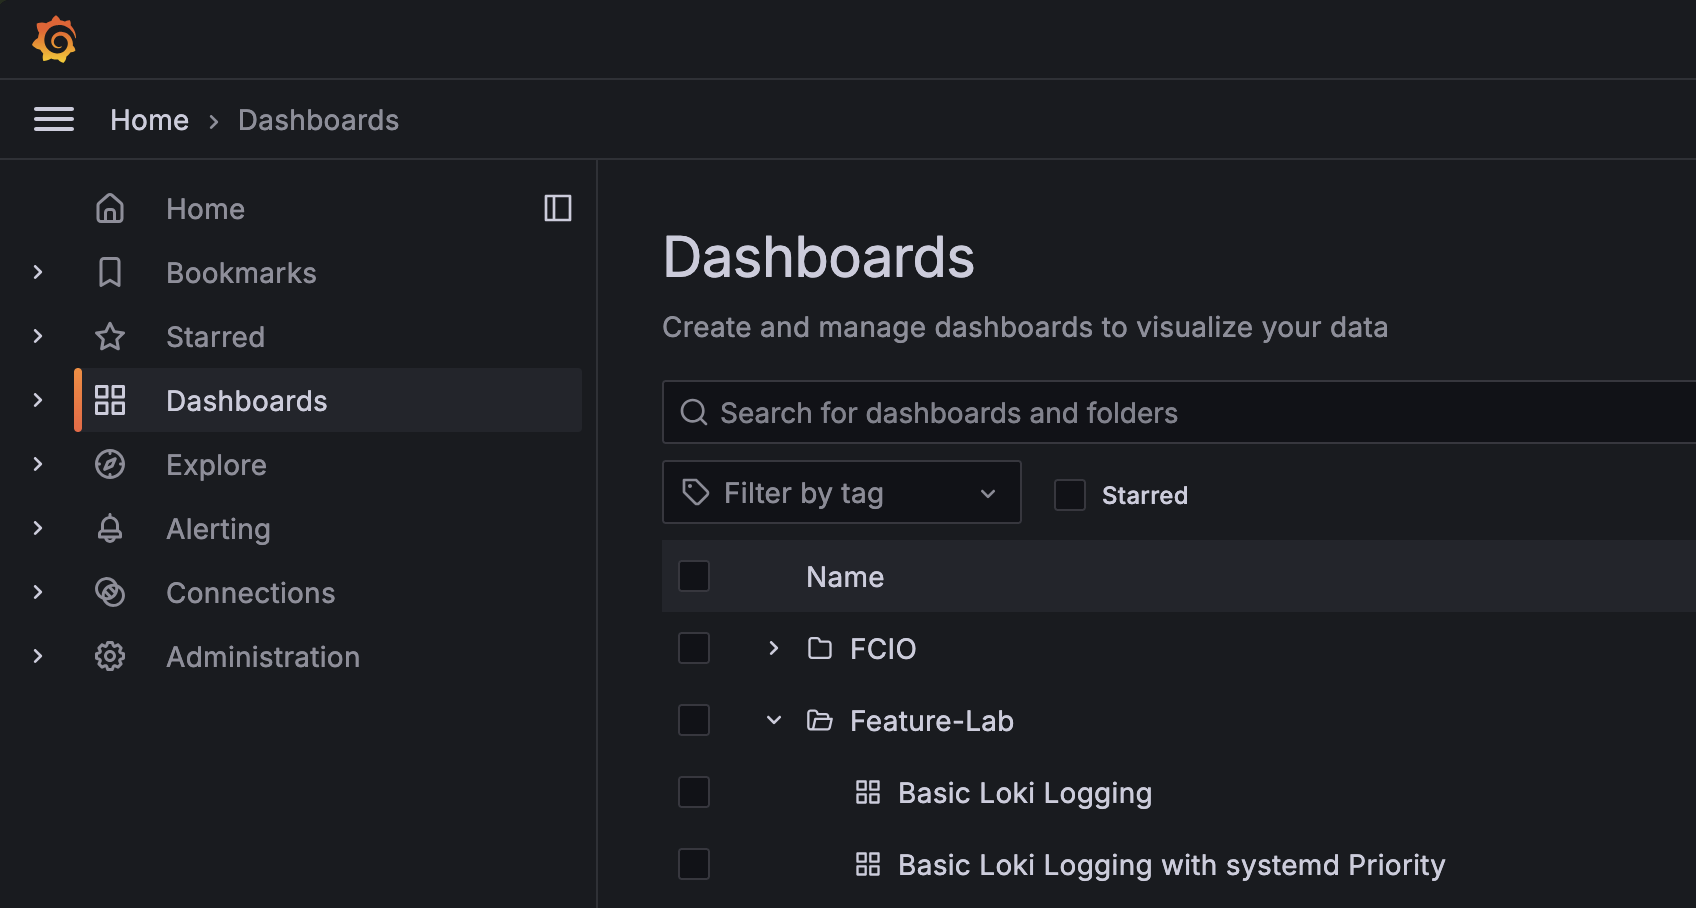
For example, the Basic Loki Logging dashboard, which visualizes log lines by selected services on selected hosts visualising output from the fc-agent
service on the VM test01: